I wanted to understand how visual anomaly detection works by building a small, hands-on PoC. Using the public VisA PCB dataset, I prepared the data, explored normal-only CNN features, tested ROI scoring and robustness, and trained supervised YOLO models. This showcase brings together what I tried, what worked, what didn't, and what I learned.
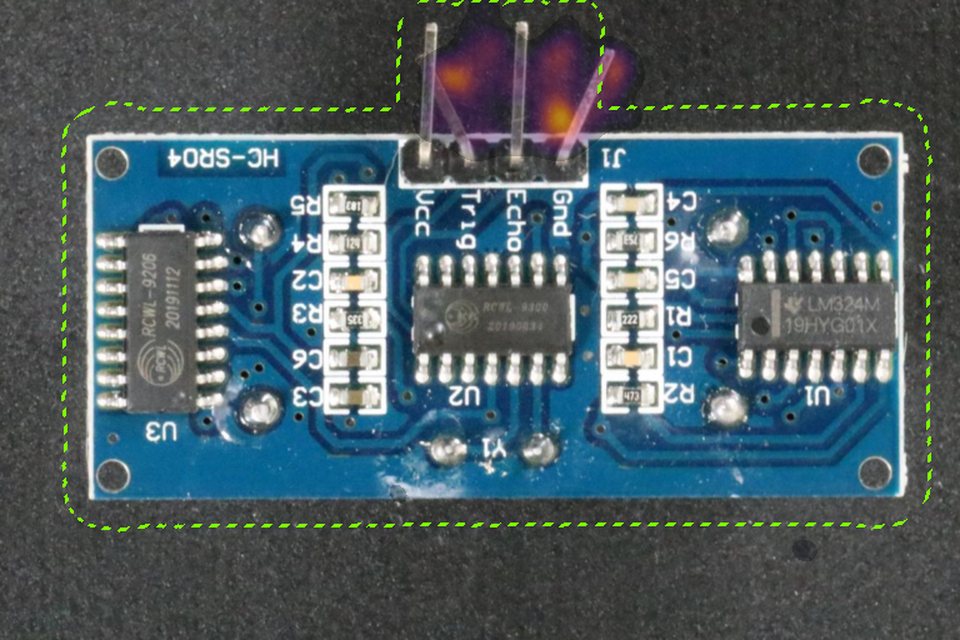
PCB2 / A detected anomaly. Heatmap from the normal-only CNN pipeline; dashed outline marks the scoring region.
THREE TECHNICAL EXPLORATIONS
Different questions. Different approaches.
These rounds belong together as a learning journey. PCB1, PCB2, PCB3 and PCB4 are separate board datasets, not a shared test set or one jointly retrained model.
APCB1
CNN Baseline
Can a model of normal appearance reveal an unfamiliar defect?
Normal images for fitting
Data inspection
Orientation & image alignment
Pretrained WideResNet-50-2 features
Per-position Gaussian / Mahalanobis distance
Image anomaly score & heatmap
Orientation, registration and background interference shaped the baseline.
Learn the data before changing the model.
BPCB2 / PCB3
Improve and Stress-Test
Can preprocessing reduce noise without creating a new failure mode?
Separate PCB2 & PCB3 experiments
CNN baseline
Board ROI scoring
Threshold calibration
Controlled lighting correction experiment
Robustness evaluation & engineering decision
PCB2 tested ROI scoring; PCB3 separately tested illumination correction.
Test how brighter, darker, contrast-adjusted and blurred images affect detection.
CPCB4
Supervised YOLO
What changes when defect examples and annotations are available?
Defect annotations for training
PCB4 defect annotations
Mask-to-bounding-box conversion
YOLOv8s / YOLO11s training
Calibration & image-level detection
Failure & acquisition-confound analysis
Actually trained with one generic defect class; labels differ from normal-only fitting.
Check both the model score and whether the box locates the defect correctly.
WHAT ACTUALLY HAPPENED
The useful part was in the failures.
A few representative results from frozen score records. Each finding stays attached to its own dataset and evaluation setting.
A
Model normal appearance first
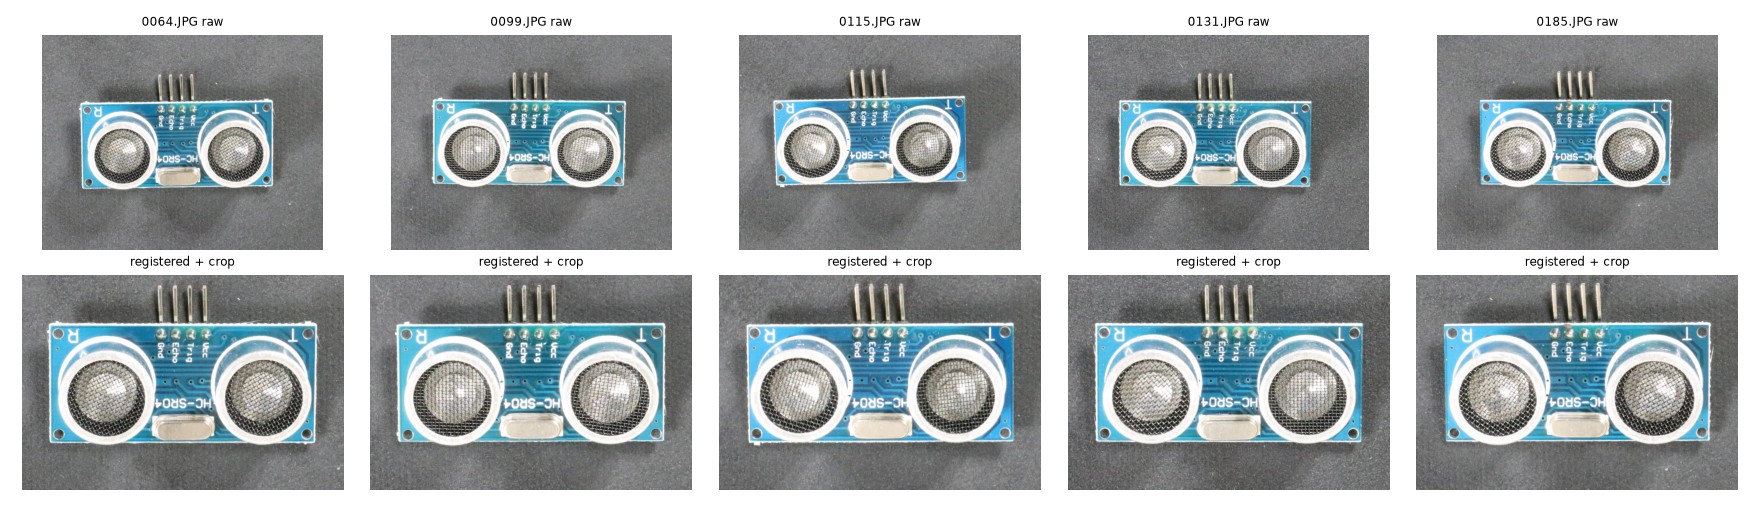
PCB1 normal images: raw inputs above, aligned crops below.
Question
Could pretrained CNN features identify deviations without defect training labels?
Tried
Inspect and align PCB1 images, then fit a Gaussian at each feature-map position.
Observed
The original PCB1 baseline detected 72/100 defective test images (72% recall). Heatmaps and false alarms exposed alignment and background sensitivity.
Learned
The highest anomaly score can come from the background rather than the defect. Inspect the image and the scoring region together.
B
Improve, then challenge the improvement
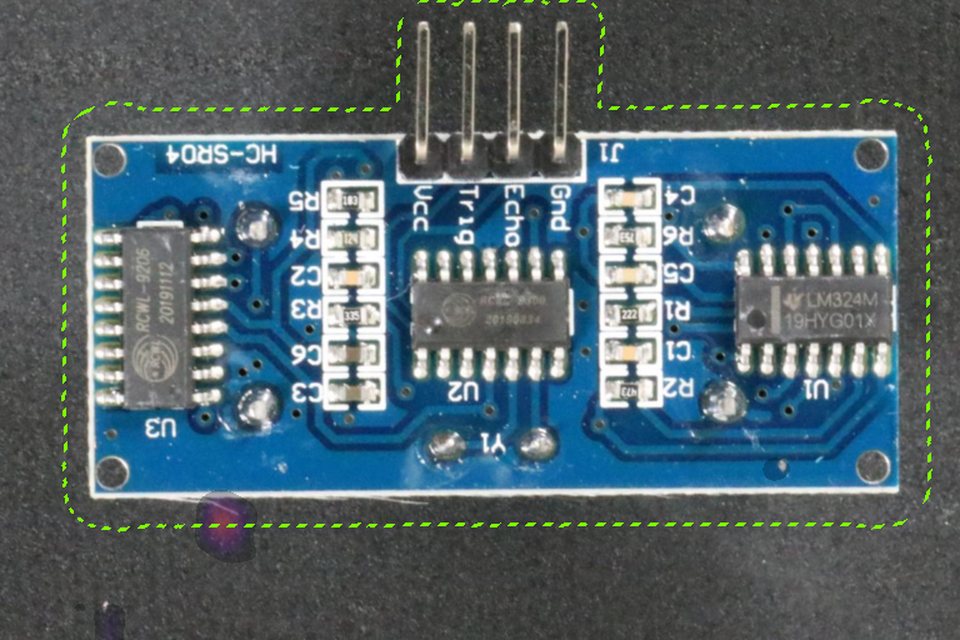
PCB2 false alarm: a normal image still triggered the ROI model.
Question
Would board-only scoring and lighting correction reduce false alarms?
Tried
Evaluate ROI scoring on PCB2; run a separate controlled correction experiment on PCB3, with calibrated thresholds and robustness checks.
Observed
PCB2: test-normal false alarms fell from 13% to 3%; recall stayed at 80%. PCB3: correction helped some lighting conditions but worsened false alarms under blur. The candidate was not adopted.
Learned
Fix the source of interference, then look for trade-offs. Improving one condition does not establish robustness.
C
Learn what supervision buys
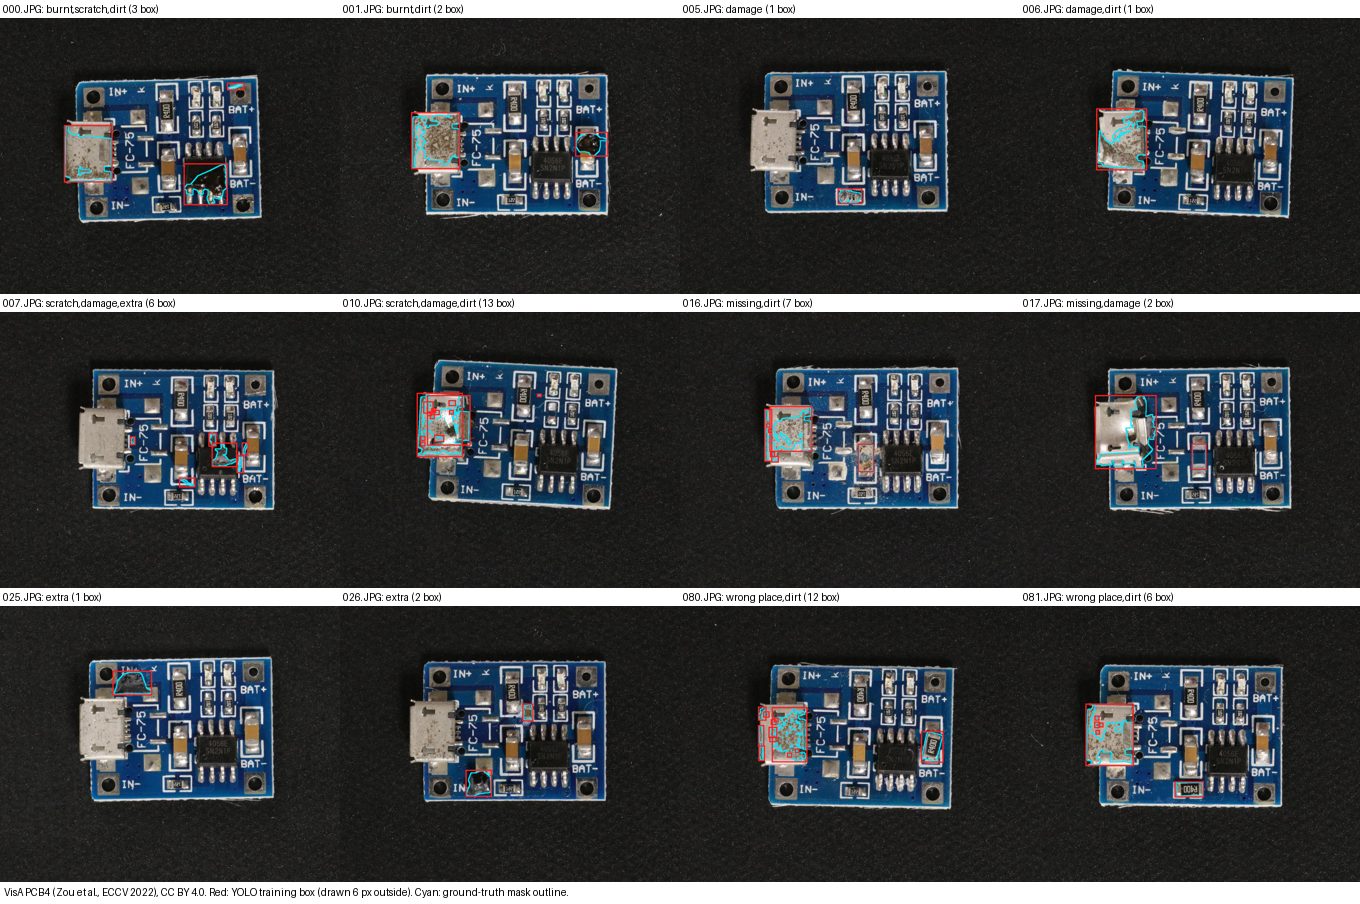
PCB4 label audit: red training boxes, cyan ground-truth masks. These are annotations, not model predictions.
Question
How would labelled defects change image-level detection?
Tried
Convert PCB4 masks to boxes and train YOLOv8s and YOLO11s, using one generic defect class and held-out defect folds.
Observed
Observed image-level recall: YOLOv8s 98% and YOLO11s 95%. Recall was higher in this supervised setting, but brightness confounding, weaker generalization to unseen defect types, and localization limitations remained.
Learned
An image flagged as defective does not mean its box precisely locates the defect. This exploratory study does not establish architecture superiority.
CNN fitting used normal images only. YOLO used defect annotations. Dataset, supervision and protocol differences prevent a controlled cross-round model ranking.
WHAT I LEARNED
Four lessons I would carry forward.
01
Data quality and preprocessing matter.
Check orientation, alignment, board masks and image conditions before trusting a score.
02
Investigate the root cause before increasing complexity.
False-alarm images helped identify background interference and motivated ROI scoring.
03
Better metrics can introduce unexpected trade-offs.
The PCB3 lighting correction helped some conditions and created a blur failure.
04
Model choice depends on data, labels and objectives.
Normal-only modelling and supervised detection answer different questions and require different evidence.
EXPLORE THE CODE
A concise showcase. A technical record behind it.
The repository keeps the real source, experimental protocols, split descriptions, score records, model-comparison limitations, audit evidence and D5 chronology.