Fab Simulation, Monitoring & Decision Support
Wafer Fab AI Operations Decision Engine
A transparent, explainable simulation decision engine: every decision number is validated against a known baseline and remains traceable.
晶圓廠 AI 營運決策引擎
透明可解釋的模擬決策引擎,每個決策數字都在已知基準上驗證、可溯源
Diagnose
Read a public 4TU job-shop manufacturing production log, then summarize case paths, DFG, cycle time, waiting time, and rework signals.
診斷
讀取公開 4TU.ResearchData 的 job-shop manufacturing production log,整理 case path、DFG、cycle time、waiting time 與 rework 訊號,作為真實製造紀錄的流程診斷示範。
Model
Build a fixed-seed synthetic fab with batch furnace and re-entrant litho, then test each method against known bottlenecks and injected anomalies.
建模
建立固定 seed 的合成 fab,包含 batch furnace 與 re-entrant LITHO,再用已知瓶頸和刻意注入的異常檢查方法是否抓得到答案。
Support Decisions
- Which tool to add first
- Maintenance timing
- Dispatching rules
- Output and yield trade-offs
- Slow-drift monitoring detection
協助決策
- 該優先加哪個機台
- 維修時機判斷
- 派工規則
- 產出與良率取捨
- 慢性劣化監控偵測
Three Core Highlights三大核心亮點
Full-view analysis to avoid intuition-driven mistakes
全方位分析,避免直覺誤判
1 - A single metric only gives a partial signal
| Station | Processing Time | Utilization | Lots Processed per Run |
|---|---|---|---|
| LITHO | 0.85 h/lot | 85%highest | 1 lot |
| FURNACE | 3.00 h/batchlongest | 37.5% | 4 lotslargest |
| DEPO | 1.30 h/lot | 65% | 1 lot |
| METRO | 0.90 h/lot | 45% | 1 lot |
Note: A lot is the production batch unit tracked through the line.
FURNACE looks important because it is slow per batch and can process 4 lots each time it runs. LITHO looks important because it is loaded closest to its capacity limit.
1 - 單一指標只能傳達片面訊息
| 站點 | 加工時間 | 稼動率 | 每次運轉可處理的 lots |
|---|---|---|---|
| LITHO | 0.85 小時/lot | 85%最高 | 1 lot |
| FURNACE | 3.00 小時/batch最長 | 37.5% | 4 lots最大 |
| DEPO | 1.30 小時/lot | 65% | 1 lot |
| METRO | 0.90 小時/lot | 45% | 1 lot |
註:lot 是生產流程中被追蹤的一個批次單位。
FURNACE 看起來重要,是因為單批加工時間長,而且每次運轉可處理 4 lots。LITHO 看起來重要,是因為它最接近產能上限。
2 - Capacity what-if shows the system impact
| Station | Added Tool | Added Lot-Processing Slots | Avg Cycle-Time Reduction |
|---|---|---|---|
| LITHO | +1 tool | ||
| FURNACE | +1 tool | ||
| DEPO | +1 tool | ||
| METRO | +1 tool |
Method: Cycle-time reduction = baseline average lot cycle time minus the average lot cycle time after adding one tool to that station. Negative table values mean the scenario's average cycle time is lower than baseline.
Estimates come from CRN-paired what-if replications (N=30); the LITHO reduction is 2.46 h with a 95% CI of 2.13-2.79 h.
FURNACE looks important because one added tool can process 4 lots at a time. But adding one FURNACE tool only reduces average cycle time by about 0.70 hours. Adding one LITHO tool processes only 1 additional lot at a time, but reduces average cycle time by about 2.46 hours. In this scenario, the better capacity decision is the station that reduces whole-line cycle time the most, not the station that adds the most lot-processing slots.
2 - 產能 what-if 比較整體影響
| 站點 | 新增工具 | 新增可處理的 lots | 平均 cycle time 下降 |
|---|---|---|---|
| LITHO | +1 台 | ||
| FURNACE | +1 台 | ||
| DEPO | +1 台 | ||
| METRO | +1 台 |
方法:cycle-time 下降 = 基準情境的平均 lot cycle time - 加一台工具後的平均 lot cycle time。表中的負值代表該情境的平均 cycle time 比基準更短。
數據來自 CRN 配對的 what-if 重複實驗(N=30);LITHO 的降幅為 2.46 小時,95% CI 為 2.13-2.79 小時。
FURNACE 看似重要,因為新增一台可以多處理 4 lots。但新增一台 FURNACE 工具,只讓平均 cycle time 下降約 0.70 小時。新增一台 LITHO 一次只多處理 1 lot,卻讓平均 cycle time 下降約 2.46 小時。在此情境,較好的產能決策不是新增最多 lot-processing slots 的站點,而是最能降低整條線 cycle time 的站點。
3 - Investment stress: when operational and financial rankings reverse3 - 投資壓力情境:營運與財務排名的反轉
| Station站點 | Avg Cycle-Time Reduction平均 cycle time 降幅 | Investment-Stress Net Cost Change投資壓力情境淨成本變化 | Decision Tension決策張力 |
|---|---|---|---|
| LITHO | Largest cycle-time reduction, but higher investment costcycle time 降幅最大,但投資成本較高 | ||
| FURNACE | Lower cost pressure, but smaller cycle-time gain成本壓力較低,但 cycle time 改善較小 | ||
| DEPO | Small improvement, weak business case改善幅度小,商業理由偏弱 | ||
| METRO | Minimal system impact對整體系統影響很小 |
Negative values save cost versus baseline; positive values add cost.
(負值代表相對基準省錢;正值代表成本增加)
When metrics conflict
If the priority is shortening cycle time, the better choice may be paying higher cost for a larger cycle-time improvement.
If short-term financial return is the priority, the better choice may be the option with the strongest net saving or fastest payback.
If both matter, first define the minimum cycle-time improvement required, then choose the most cost-effective option that meets that threshold.
當指標衝突時
如果優先目標是縮短 cycle-time,較好的選擇可能是支付較高成本換取較大的 cycle-time 改善。
如果優先目標是短期財務回報,較好的選擇可能是淨節省最高或回收最快的方案。
如果兩者都重要,先定義最低需要的 cycle-time 改善門檻,再選擇符合門檻且最具成本效益的方案。
Operational impact, investment cost, and business objective must be evaluated together to find the best answer for the current situation.
營運影響、投資成本與商業目標必須綜合評估,在不同的當下情境找出最佳解。
Slow-drift monitoring: turning detection time into decision value
When equipment degrades slowly, output metrics may not warn immediately; by the time output falls, congestion cost has already accumulated. This monitoring design uses EWMA, a control-chart method sensitive to small persistent drift, as the baseline. Labeled anomaly scenarios measure detection delay and false-alarm rate, then convert alert timing into cost still avoidable. In a 160-day synthetic backtest, an output-only monitor stays silent over the whole horizon; EWMA alerts on day 84, meaning this experiment's EWMA method can avoid the extra degradation cost that would accumulate over the following 76 days.
慢性劣化監控:把偵測時間轉成決策價值
設備緩慢劣化時,產出指標可能尚無警訊,等產出下滑,早已累積了一定的壅塞成本。本專案的監控設計以 EWMA 對小幅持續漂移敏感的管制圖方法作為基線,用標註好的異常情境量測偵測延遲與誤報率,再把警報時間點換算成仍可避免的成本。在 160 天的合成回測中,只看產出的監控整段期間沒有發出任何警報;EWMA 在第 84 天發出警報,也就代表在此實驗中使用EWMA方法可以節省後面76天因劣化產生的額外成本。
| Monitoring approach | Signal watched | Alert logic | Result |
|---|---|---|---|
| 監控方式 | 監控訊號 | alert 邏輯 | 結果 |
| Output-only monitor只看 output 的監控 | Daily output / throughputDaily output / throughput | Alert only when output drops below the clean baseline lower control limit.只有當 output 低於乾淨 baseline 的下控制線時才 alert。 | No alert within 160 days160 天內沒有 alert |
| EWMA drift monitorEWMA 漂移監控 | Daily median lot cycle time每日 lot cycle time 中位數 | Alert when small persistent cycle-time drift accumulates.小而持續的 cycle-time 偏移累積後 alert。 | Alert on day 84day 84 alert |
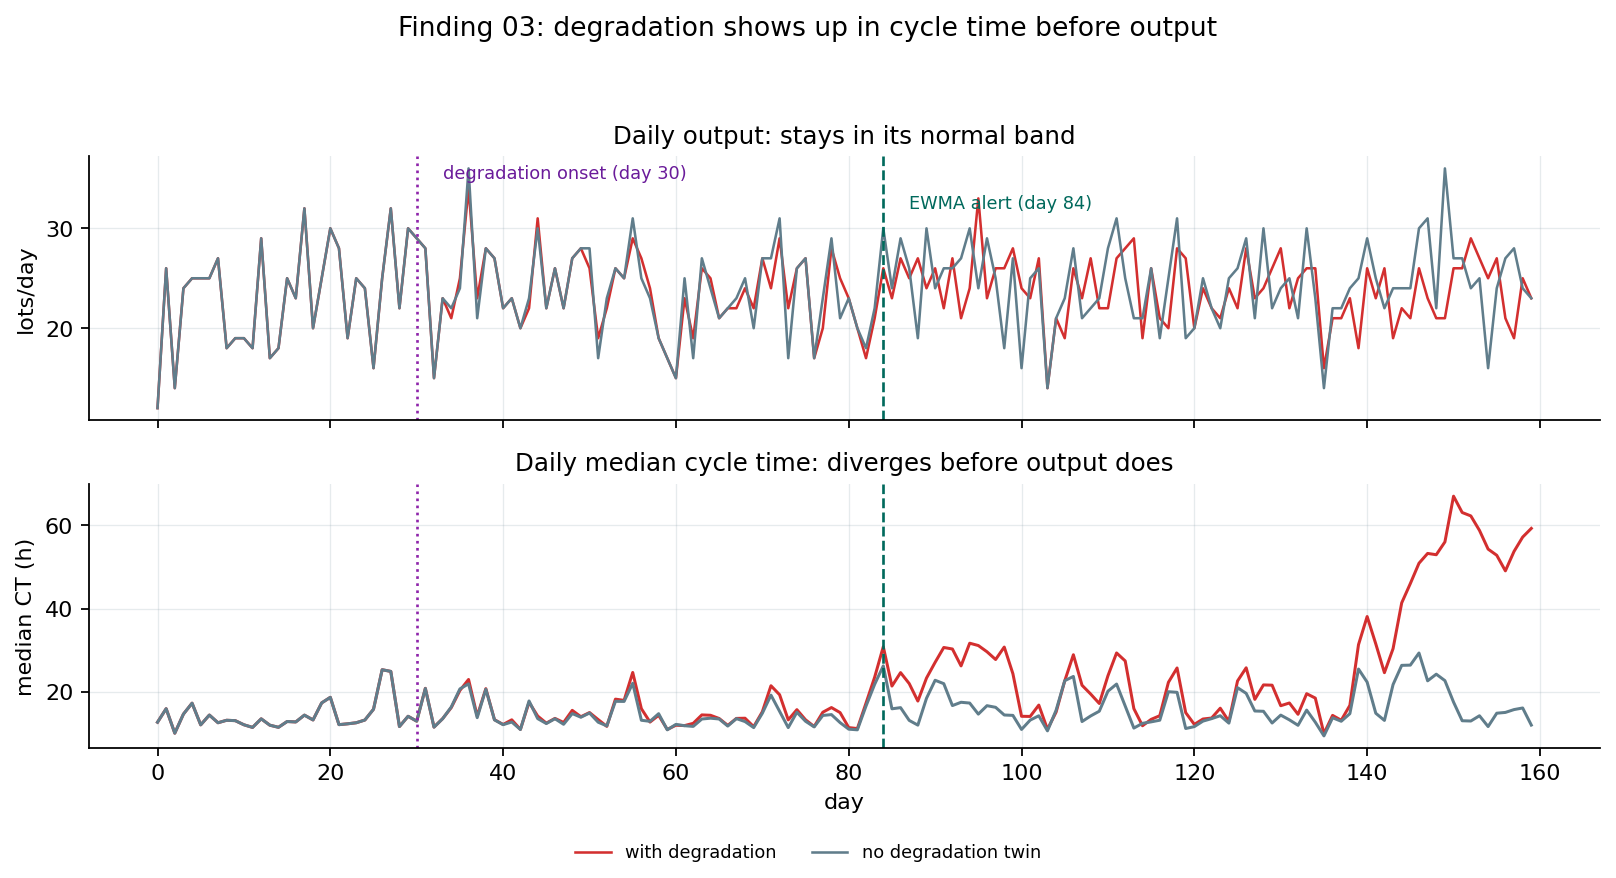
Observation: daily output remains noisy but ordinary, while daily median cycle time separates from the clean twin after degradation starts.
圖表觀察:daily output 看起來仍在正常波動中,但 daily median cycle time 在 degradation 開始後逐漸和 clean twin 分離。
Another advantage is that this workflow can be backtested: it checks whether a drift detector finds the problem before output makes it obvious, then estimates how much future cost early action can avoid.
另一個優勢是這個流程可以 backtest:先檢查 drift detector 是否能在 output 明顯變差前找到問題,再估算及早行動可以避免多少後續成本。
One agent, four classes of fab operations questions
One agent contains analysis modules for four operations questions: how to add tools, maintenance timing, dispatching rules, and output-yield trade-offs. Each analysis records scenario, seed, assumptions, and KPI results in the same format, so the numbers are traceable. This means a future AI agent can produce decision memos by calling the same what-if engine, with traceable results instead of freely generated answers.
一個agent,回答四類 fab 營運問題
一個agent內包含:該如何加機台、維修時機判斷、派工規則、產出與良率取捨,四個營運問題的分析流程模組。每次分析都用相同格式留下 scenario、seed、假設與 KPI 結果,讓數字可以追溯。這代表未來若要讓 AI agent 產出決策備忘錄,它呼叫的是同一套 what-if engine,且結果有跡可循,而不是自由生成答案。
Capacity investment
Which station should receive the next tool? 先加哪一站的 tool?Provides simulation data for different tool-addition cases.
提供針對不同機台添加情況的模擬數據。
Maintenance timing
Maintain now or wait? 現在 PM 還是延後?Provides PM cost estimates under different scenarios.
提供不同情境下 PM 的成本評估。
Dispatching policy
Which queue rule fits the objective? 哪個 queue rule 符合目標?Shows the best dispatch policy under different operating objectives.
提供不同運營目標下,最佳 dispatch policy。
Yield trade-offs
Does faster flow increase quality risk? 加速 flow 是否增加 quality risk?Provides multiple KPI perspectives for combined evaluation.
提供不同面向指標,便利使用者綜合評估。
References參考文獻
Core project value
Turn messy operational data into clear, credible, executable manufacturing decisions.
From bottleneck diagnosis and anomaly monitoring to capacity investment, this project builds an automated decision-support workflow that helps operations teams decide faster and more precisely.
專案核心價值
把雜亂的營運數據,轉成清楚、可信、可執行的製造決策。
從瓶頸診斷、異常監控到產能投資,建立一套讓營運決策更快、更精準的自動化輔助流程。
Scope: the simulated line is clearly labeled synthetic; it exists to give the methods a known ground truth (an engineered bottleneck, labeled fault windows). The real production log is used for diagnosis only. Cost figures are illustrative and used for ranking, not as dollar forecasts.
聲明:模擬產線全程標示為合成資料。它的用途是給方法一個已知的「標準答案」 (刻意設計的瓶頸、標記好的故障區間)。真實生產紀錄僅用於診斷。成本數字為示意性質,用於相對排序, 並非金額預測。